FiberLab Scripts
Browse Images
fiberlab_browse_images is a simple utility that lets you browse all the
images in a given directory.
The script usage can be displayed by calling the script with the
-h option:
$ fiberlab_browse_images -h
usage: fiberlab_browse_images [-h] [-e EXT] root

Browse images in a directory

positional arguments:
  root               Directory with output files.

optional arguments:
  -h, --help         show this help message and exit
  -e EXT, --ext EXT  Image extension (default: .fit)
The script trolls through the directory you point it two and shows you the following image:
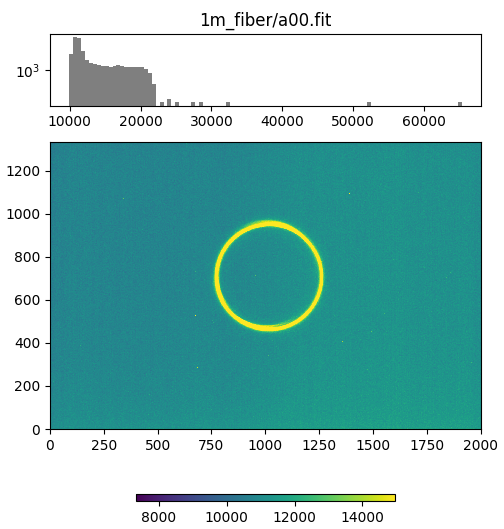
Image from fiberlab_browse_images with the observed image and colorbar at
the bottom and a histrogram of the pixel values at the top with the image
name.
Analysis of far-field output images from collimated input
fiberlab_collimated_farfield analyzes a single far-field image from a
collimated input beam.
The script usage can be displayed by calling the script with the
-h option:
$ fiberlab_collimated_farfield -h
usage: fiberlab_collimated_farfield [-h] [-b BKG_FILE] [-p PIXELSIZE]
                                    [-d DISTANCE] [-t THRESHOLD] [-w] [-s]
                                    [-r RING_BOX]
                                    img_file

Calculate results for a collimated FRD test.

positional arguments:
  img_file              File with far-field output image from a collimated input

optional arguments:
  -h, --help            show this help message and exit
  -b BKG_FILE, --bkg_file BKG_FILE
                        File with only background flux (default: None)
  -p PIXELSIZE, --pixelsize PIXELSIZE
                        Size of the image camera pixels in mm. (default: 0.018)
  -d DISTANCE, --distance DISTANCE
                        Distance between the fiber output and the camera
                        detector (default: None)
  -t THRESHOLD, --threshold THRESHOLD
                        S/N threshold that sets the contour used to identify the
                        center of the output ring. (default: 1.5)
  -w, --window          Display the QA plot in a window; do not write it to a
                        file. (default: False)
  -s, --snr_img         If creating the QA plot, show the estimated S/N of the
                        data instead of the counts. (default: False)
  -r RING_BOX, --ring_box RING_BOX
                        Limit the plotted image regions to this times the best-
                        fitting peak of the ring flux distribution. If None, the
                        full image is shown. (default: None)
You provide the image to analyze and (optionally) a background image and it will measure the properties of the image. It can either write the QA image to a file, or simply open a window with the result. An example call might be:
fiberlab_collimated_farfield z0_closer.fit -b bg0.fit -t 2. -w
which will produce an image that looks like this:
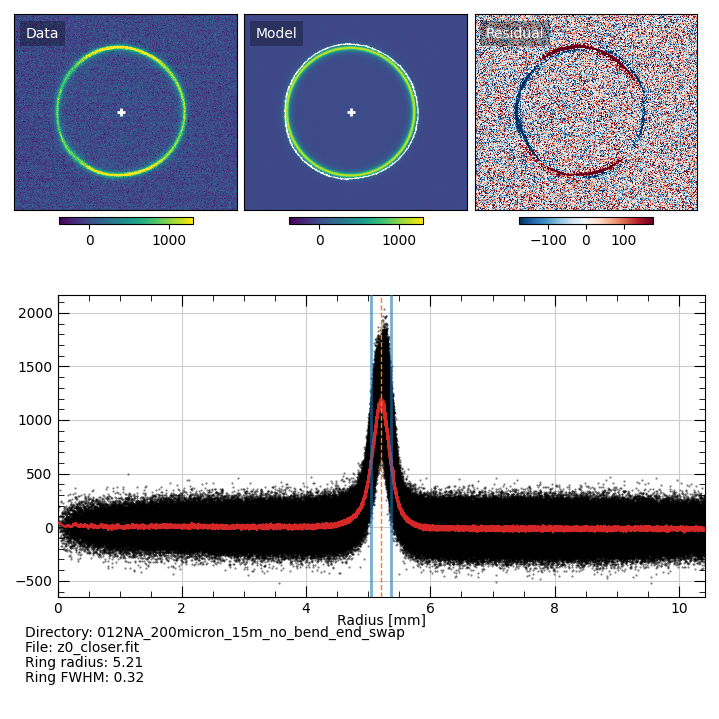
QA plot from fiberlab_collimated_farfield. Top-left is the observed
data, top-center is the “model”, and top-right is the difference, which is
meant to accentuate non-axisymmetries in the data. The white cross in the
top-left and top-center panels show the measured center of the ring measured
using the white contour in the top-center panel. The white contour is for
the observed data, but it is shown in the model panel so that it doesn’t
obscure inspection of the observed data. The bottom panel shows the radial
distribution of the flux, centered on the white cross. The black points are
the measured data, the red line is the result of applying a Savitzky-Golay
filter to the data, the blue lines mark the measured FWHM of the ring
profile, and the dashed orange line mark the peak value.
The script also prints the measured results:
# Result from fobos_collimated_farfield script
# Written: Mon 03 Oct 2022 12:50:18
# Image file: z0_closer.fit
# Pixelsize: 0.018 mm
# Ring radius:    2.45
# Ring peak flux: 1219.00
# Ring FWHM:      0.54
You can analyze a typical dataset collected for focal-ratio-degradation
measurements using fiberlab_collimated_FRD.
The script usage can be displayed by calling the script with the
-h option:
$ fiberlab_collimated_farfield -h
usage: fiberlab_collimated_farfield [-h] [-b BKG_FILE] [-p PIXELSIZE]
                                    [-d DISTANCE] [-t THRESHOLD] [-w] [-s]
                                    [-r RING_BOX]
                                    img_file

Calculate results for a collimated FRD test.

positional arguments:
  img_file              File with far-field output image from a collimated input

optional arguments:
  -h, --help            show this help message and exit
  -b BKG_FILE, --bkg_file BKG_FILE
                        File with only background flux (default: None)
  -p PIXELSIZE, --pixelsize PIXELSIZE
                        Size of the image camera pixels in mm. (default: 0.018)
  -d DISTANCE, --distance DISTANCE
                        Distance between the fiber output and the camera
                        detector (default: None)
  -t THRESHOLD, --threshold THRESHOLD
                        S/N threshold that sets the contour used to identify the
                        center of the output ring. (default: 1.5)
  -w, --window          Display the QA plot in a window; do not write it to a
                        file. (default: False)
  -s, --snr_img         If creating the QA plot, show the estimated S/N of the
                        data instead of the counts. (default: False)
  -r RING_BOX, --ring_box RING_BOX
                        Limit the plotted image regions to this times the best-
                        fitting peak of the ring flux distribution. If None, the
                        full image is shown. (default: None)
It expects to find two images called z0* and z1* that are used to
calibrate the distance from the fiber output to the z1* image, and then a
series of a* images that provide far-field images with different input
angles. QA plots like the one above are produced for all images, and the
measurements are provided in a fixed-width ascii table, which looks like this:
# Result from fobos_collimated_FRD script
# Written: Fri 09 Sep 2022 08:23:35
#
# Top-level directory: /Users/westfall/Work/FOBOS/akamai/2022/ssl_tests/2022_07_19/012NA_200micron_15m_no_bend_end_swap
#
# Pixelsize: 0.018 mm
# Z image separation: 3.81 mm
#
# Z0 image:
#     File:           z0_closer.fit
#     Background:     bg0.fit
#     S/N Threshold:  2.0
#     Ring radius:    5.21
#     Ring peak flux: 809.00
#     Ring FWHM:      0.32
# Z1 image:
#     File:           z1_farther.fit
#     Background:     bg0.fit
#     S/N Threshold:  1.5
#     Ring radius:    6.10
#     Ring peak flux: 704.00
#     Ring FWHM:      0.37
#
# Distance from fiber output to z1 image: 26.04 mm
#
# Angle sweep results
# Radius and FWHM are in degrees.
#
#            FILE             BKG THRESH       PEAK      RAD     FWHM
          a00.fit         bg0.fit    1.5   1.28e+03   12.415    0.868
          a01.fit         bg0.fit    3.0   1.65e+03   11.664    0.638
          a02.fit         bg0.fit    3.0   2.55e+03   11.153    0.648
          a03.fit         bg0.fit   10.0   3.03e+03   10.840    0.643
          a04.fit         bg0.fit   10.0   4.27e+03   10.389    0.768
          a05.fit         bg0.fit   10.0   4.61e+03    9.894    1.130
          a06.fit         bg0.fit   10.0   8.86e+03    8.786    0.821
          a07.fit         bg0.fit   10.0   8.91e+03    8.219    0.853
          a08.fit         bg0.fit   10.0   1.04e+04    7.375    1.215
          a09.fit         bg0.fit   10.0   1.67e+04    6.779    1.439
          a12.fit         bg0.fit   10.0   2.29e+04    6.496    1.505
          a13.fit         bg0.fit   10.0   3.16e+04    6.427    1.242
          a14.fit         bg0.fit   10.0   3.79e+04    5.968    1.176
          a15.fit         bg0.fit   10.0   3.52e+04    5.430    1.334
          a16.fit         bg0.fit   10.0   3.20e+04    4.876    1.652
          a17.fit         bg0.fit   10.0   2.77e+04    4.117    2.367
          a18.fit         bg0.fit   10.0   2.83e+04    3.406    3.378
          a19.fit         bg0.fit   10.0   3.15e+04    2.628    4.173
Analysis of far-field output images from full-cone input
fiberlab_fullcone_farfield works similarly to
fiberlab_collimated_farfield, but analyzes a single far-field image from a
full-cone input beam.
The script usage can be displayed by calling the script with the
-h option:
$ fiberlab_fullcone_farfield -h
usage: fiberlab_fullcone_farfield [-h] [-b BKG_FILE] [-p PIXELSIZE]
                                  [-d DISTANCE] [-t THRESHOLD] [-w] [-s]
                                  [-r RING_BOX]
                                  img_file

Calculate results for a full-cone far-field test.

positional arguments:
  img_file              File with far-field output image from a collimated input

optional arguments:
  -h, --help            show this help message and exit
  -b BKG_FILE, --bkg_file BKG_FILE
                        File with only background flux (default: None)
  -p PIXELSIZE, --pixelsize PIXELSIZE
                        Size of the image camera pixels in mm. (default: 0.018)
  -d DISTANCE, --distance DISTANCE
                        Distance between the fiber output and the camera
                        detector (default: None)
  -t THRESHOLD, --threshold THRESHOLD
                        S/N threshold that sets the contour used to identify the
                        center of the output ring. (default: 1.5)
  -w, --window          Display the QA plot in a window; do not write it to a
                        file. (default: False)
  -s, --snr_img         If creating the QA plot, show the estimated S/N of the
                        data instead of the counts. (default: False)
  -r RING_BOX, --ring_box RING_BOX
                        Limit the plotted image regions to this times the best-
                        fitting peak of the ring flux distribution. If None, the
                        full image is shown. (default: None)
You provide the image to analyze and (optionally) a background image and it will measure the properties of the image. It can either write the QA image to a file, or simply open a window with the result. An example call might be:
fiberlab_fullcone_farfield z0.fit -b bg/bg.fit -t 10. -w -r 1.4
which will produce an image that looks like this:
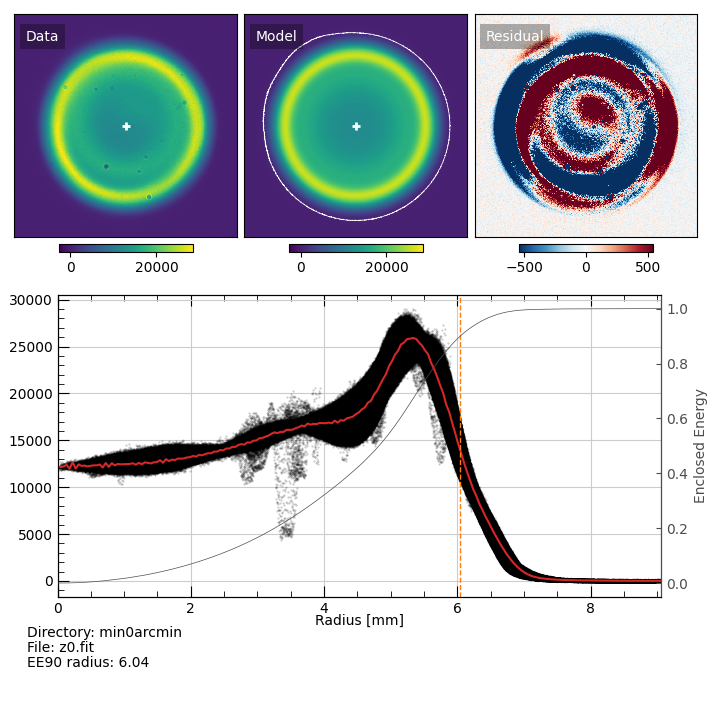
QA plot from fiberlab_fullcone_farfield. Top-left is the observed data,
top-center is the “model”, and top-right is the difference, which is meant to
accentuate non-axisymmetries in the data. The white cross in the top-left
and top-center panels show the measured center of the output beam measured
using the white contour in the top-center panel. The white contour is for
the observed data, but it is shown in the model panel so that it doesn’t
obscure inspection of the observed data. The bottom panel shows the radial
distribution of the flux, centered on the white cross. The black points are
the measured data, the red line is a smoothed version of the data, the gray
lines is the normalized enclosed energy curve, and the orange dashed line is
the radius that encloses 90% of the light (EE90).
To produce EE curves with radii that can be converted to output f/#, use
fiberlab_fullcone_ee_fratio.
The script usage can be displayed by calling the script with the
-h option:
$ fiberlab_fullcone_ee_fratio -h
usage: fiberlab_fullcone_ee_fratio [-h] [-p PIXELSIZE] [-s SEP] [-t THRESHOLD]
                                   [-r RING_BOX] [-o OROOT] [-f FILES]
                                   root ofile

Calculate results for a full-cone far-field test.

positional arguments:
  root                  Directory with output files.
  ofile                 Output file for measurements

optional arguments:
  -h, --help            show this help message and exit
  -p PIXELSIZE, --pixelsize PIXELSIZE
                        Size of the image camera pixels in mm. (default: 0.018)
  -s SEP, --sep SEP     Known separation (in mm) between the "z" images used to
                        calculate the distance from the fiber output to the main
                        imaging position. (default: 3.82)
  -t THRESHOLD, --threshold THRESHOLD
                        S/N threshold that sets the contour used to identify the
                        center of the output ring. (default: 3.0)
  -r RING_BOX, --ring_box RING_BOX
                        Limit the plotted image regions to this times the best-
                        fitting peak of the ring flux distribution. If None, the
                        full image is shown. (default: None)
  -o OROOT, --oroot OROOT
                        Directory for output files (default:
                        /Users/westfall/Work/packages/fobos/fiberlab/docs)
  -f FILES, --files FILES
                        Name of a file that provides 2 or 3 columns: (1) the
                        files to analyze, (2) the background image to use for
                        each file, and (3) the threshold to use for each file.
                        If this file is provided, any threshold is ignored and
                        the root directory is not trolled for all bg* and z*
                        files. The last column with the thresholds can be
                        omitted, which means the code will use the value
                        provided on the command line (or its default). (default:
                        None)
It expects to find two images called z0* and z1* that are used to
calibrate the distance from the fiber output to the camera. You provide the
top-level directory (it will search for background images, as well) and an
output file, and it will produced an ascii table with the EE curve for each
image. An example call might be:
fiberlab_fullcone_ee_fratio min60arcmin/ min60arcmin_rdx.txt -o min60arcmin/rdx -p 0.009
which will produce an ascii file that looks like this:
# Result from fobos_fullcone_ee_fratio script
# Written: Mon 12 Sep 2022 13:54:21
#
# Top-level directory: /Users/westfall/Work/FOBOS/akamai/2022/ssl_tests/2022_07_28/Full_cone_testing/20220728/angle_tests/min0arcmin
#
# Pixelsize: 0.009 mm
# Z0 Image:         z0.fit
# Z0 Background:    bg.fit
# Z0 S/N Threshold: 3.0
# Median Z0 distance (0.1 < EE < 0.9): 29.56 mm
# Z1 Image:         z1.fit
# Z1 Background:    bg.fit
# Z1 S/N Threshold: 3.0
# Median Z1 distance (0.1 < EE < 0.9): 33.38 mm
#
# EE is the fractional inclosed energy
# R0 is the radius in mm at the detector plane at the closest (z0) image
# R1 is the radius in mm at the detector plane at the farthest (z1) image
# F0 is the distance in mm to the closest (z0) image using R0
# F1 is the distance in mm to the farthest (z1) image using R1
# f0 is the focal ratio assuming the median z0 distance
# f1 is the focal ratio assuming the median z1 distance
#
#     EE     R0     R1     F0     F1     f0     f1
    0.01   0.39   0.44  29.84  33.66  38.21  38.25
    0.02   0.55   0.62  29.67  33.49  27.09  27.11
    0.03   0.67   0.75  29.65  33.47  22.17  22.18
    0.04   0.77   0.87  29.68  33.50  19.25  19.26
    0.05   0.86   0.97  29.70  33.52  17.26  17.27
    0.06   0.93   1.06  29.63  33.45  15.81  15.82
    0.07   1.01   1.14  29.59  33.41  14.69  14.69
    0.08   1.07   1.21  29.56  33.38  13.78  13.78
    0.09   1.13   1.28  29.56  33.38  13.04  13.04
    0.10   1.19   1.34  29.51  33.33  12.41  12.41
    0.11   1.24   1.41  29.51  33.33  11.87  11.87
    0.12   1.30   1.46  29.47  33.29  11.41  11.40
    0.13   1.34   1.52  29.34  33.16  11.00  10.99
    0.14   1.39   1.57  29.28  33.10  10.63  10.62
    0.15   1.43   1.62  29.25  33.07  10.31  10.29
    0.16   1.48   1.67  29.25  33.07  10.01  10.00
    0.17   1.52   1.71  29.31  33.13   9.75   9.74
    0.18   1.56   1.76  29.32  33.14   9.50   9.49
    0.19   1.59   1.80  29.34  33.16   9.28   9.27
    0.20   1.63   1.84  29.33  33.15   9.07   9.06
    0.21   1.66   1.88  29.39  33.21   8.88   8.87
    0.22   1.70   1.92  29.44  33.26   8.70   8.70
    0.23   1.73   1.96  29.50  33.32   8.53   8.53
    0.24   1.76   1.99  29.55  33.37   8.37   8.37
    0.25   1.80   2.03  29.59  33.41   8.23   8.23
    0.26   1.83   2.06  29.59  33.41   8.09   8.09
    0.27   1.86   2.10  29.59  33.41   7.96   7.96
    0.28   1.89   2.13  29.61  33.43   7.83   7.84
    0.29   1.92   2.16  29.60  33.42   7.72   7.72
    0.30   1.94   2.19  29.61  33.43   7.60   7.60
    0.31   1.97   2.23  29.59  33.41   7.50   7.50
    0.32   2.00   2.26  29.60  33.42   7.39   7.39
    0.33   2.03   2.29  29.61  33.43   7.29   7.29
    0.34   2.05   2.32  29.58  33.40   7.20   7.20
    0.35   2.08   2.35  29.60  33.42   7.11   7.11
    0.36   2.11   2.38  29.57  33.39   7.02   7.02
    0.37   2.13   2.41  29.57  33.39   6.94   6.94
    0.38   2.16   2.43  29.56  33.38   6.86   6.86
    0.39   2.18   2.46  29.58  33.40   6.78   6.78
    0.40   2.20   2.49  29.57  33.39   6.71   6.71
    0.41   2.23   2.51  29.55  33.37   6.64   6.64
    0.42   2.25   2.54  29.55  33.37   6.57   6.57
    0.43   2.27   2.57  29.53  33.35   6.50   6.50
    0.44   2.29   2.59  29.54  33.36   6.44   6.44
    0.45   2.31   2.61  29.50  33.32   6.38   6.38
    0.46   2.34   2.64  29.50  33.32   6.33   6.33
    0.47   2.36   2.66  29.49  33.31   6.27   6.27
    0.48   2.38   2.68  29.49  33.31   6.22   6.22
    0.49   2.39   2.70  29.48  33.30   6.17   6.17
    0.50   2.41   2.72  29.48  33.30   6.13   6.13
    0.51   2.43   2.74  29.47  33.29   6.08   6.08
    0.52   2.45   2.76  29.47  33.29   6.04   6.04
    0.53   2.46   2.78  29.46  33.28   6.00   6.00
    0.54   2.48   2.80  29.46  33.28   5.96   5.96
    0.55   2.50   2.82  29.47  33.29   5.92   5.92
    0.56   2.51   2.84  29.48  33.30   5.88   5.88
    0.57   2.53   2.85  29.47  33.29   5.85   5.85
    0.58   2.54   2.87  29.50  33.32   5.81   5.81
    0.59   2.56   2.89  29.50  33.32   5.78   5.78
    0.60   2.57   2.90  29.50  33.32   5.75   5.75
    0.61   2.58   2.92  29.51  33.33   5.72   5.72
    0.62   2.60   2.94  29.52  33.34   5.69   5.69
    0.63   2.61   2.95  29.53  33.35   5.66   5.66
    0.64   2.63   2.97  29.53  33.35   5.63   5.63
    0.65   2.64   2.98  29.54  33.36   5.60   5.60
    0.66   2.65   3.00  29.56  33.38   5.57   5.57
    0.67   2.67   3.01  29.56  33.38   5.54   5.54
    0.68   2.68   3.03  29.58  33.40   5.51   5.51
    0.69   2.69   3.04  29.60  33.42   5.49   5.49
    0.70   2.71   3.06  29.61  33.43   5.46   5.46
    0.71   2.72   3.07  29.62  33.44   5.43   5.43
    0.72   2.73   3.09  29.62  33.44   5.40   5.41
    0.73   2.75   3.10  29.63  33.45   5.38   5.38
    0.74   2.76   3.12  29.63  33.45   5.35   5.35
    0.75   2.78   3.13  29.64  33.46   5.32   5.33
    0.76   2.79   3.15  29.66  33.48   5.30   5.30
    0.77   2.80   3.17  29.66  33.48   5.27   5.27
    0.78   2.82   3.18  29.67  33.49   5.24   5.25
    0.79   2.83   3.20  29.68  33.50   5.22   5.22
    0.80   2.85   3.22  29.69  33.51   5.19   5.19
    0.81   2.86   3.23  29.70  33.52   5.16   5.16
    0.82   2.88   3.25  29.71  33.53   5.13   5.13
    0.83   2.90   3.27  29.72  33.54   5.10   5.11
    0.84   2.91   3.29  29.72  33.54   5.07   5.08
    0.85   2.93   3.31  29.74  33.56   5.04   5.05
    0.86   2.95   3.33  29.74  33.56   5.01   5.02
    0.87   2.97   3.35  29.74  33.56   4.98   4.98
    0.88   2.99   3.37  29.74  33.56   4.95   4.95
    0.89   3.01   3.39  29.72  33.54   4.91   4.92
    0.90   3.03   3.42  29.71  33.53   4.88   4.88
    0.91   3.05   3.45  29.68  33.50   4.84   4.84
    0.92   3.08   3.48  29.66  33.48   4.80   4.80
    0.93   3.11   3.51  29.65  33.47   4.76   4.76
    0.94   3.14   3.54  29.63  33.45   4.71   4.71
    0.95   3.17   3.58  29.61  33.43   4.66   4.66
    0.96   3.21   3.63  29.60  33.42   4.60   4.60
    0.97   3.26   3.68  29.59  33.41   4.53   4.53
    0.98   3.33   3.76  29.54  33.36   4.44   4.44
    0.99   3.43   3.88  29.10  32.92   4.31   4.30
Total Throughput
Provided observations of both input and output far-field images,
fiberlab_fullcone_throughput will measure the total throughput.
The script usage can be displayed by calling the script with the
-h option:
$ fiberlab_fullcone_throughput -h
usage: fiberlab_fullcone_throughput [-h] [-b BKG_IMG] [-t THRESHOLD]
                                    inp_img out_img

Calculate results for a full-cone far-field test.

positional arguments:
  inp_img               File with an image of the input beam
  out_img               File with an image of the output beam

optional arguments:
  -h, --help            show this help message and exit
  -b BKG_IMG, --bkg_img BKG_IMG
                        File with only background flux (default: None)
  -t THRESHOLD, --threshold THRESHOLD
                        S/N threshold that sets the contour used to identify the
                        center of the output ring. (default: 1.5)
An example call looks like:
fiberlab_fullcone_throughput farfield_in/f2.fit fiber_out2/z0.fit -b fiber_out/bg/bg.fit -t 5.
which will write the following to the screen:
# Result from fobos_fullcone_throughput script
# Written: Mon 03 Oct 2022 13:36:56
# Input image: f2.fit
# Output image: z0.fit
# Background image: bg.fit
# Input flux:  8.774e+09
# Output flux:  7.207e+09
# Throughput:  0.821